Inhaltsverzeichnis
2017 Pauline Reiff
| Modul-Icon | … |
|---|---|
| Veranstaltung | … |
| Autor | … |
| Bearbeitungsdauer | … |
| Präsentationstermin | … |
| Zuletzt geändert | … |
Abstract
During locomotion, animals and humans are confronted to changing grounds with different compliance and levels (heights). In order to maintain an efficient and stable gait, it is important to adapt quickly to these variations.
The synthesis of a biological movement can be divided in two parts: the system dynamics and the control. The system dynamics includes the rigid body dynamics (mechanics of the limb segments for example and its geometry) and the muscle-tendon dynamics. Each muscle or group of muscles in a limb has a control system, which is composed of feedforward signals and feedback (reflexes) signals.
The goal will be to understand the contribution of structure and control in the synthesis of a biological movement. For that, a model which represents the interplay of structure with control in human hopping is developed. The whole analysis will be based on a vertical hopping on the spot. The model is based on the two-segmented leg model with one extensor muscle of Geyer et al.
The Model
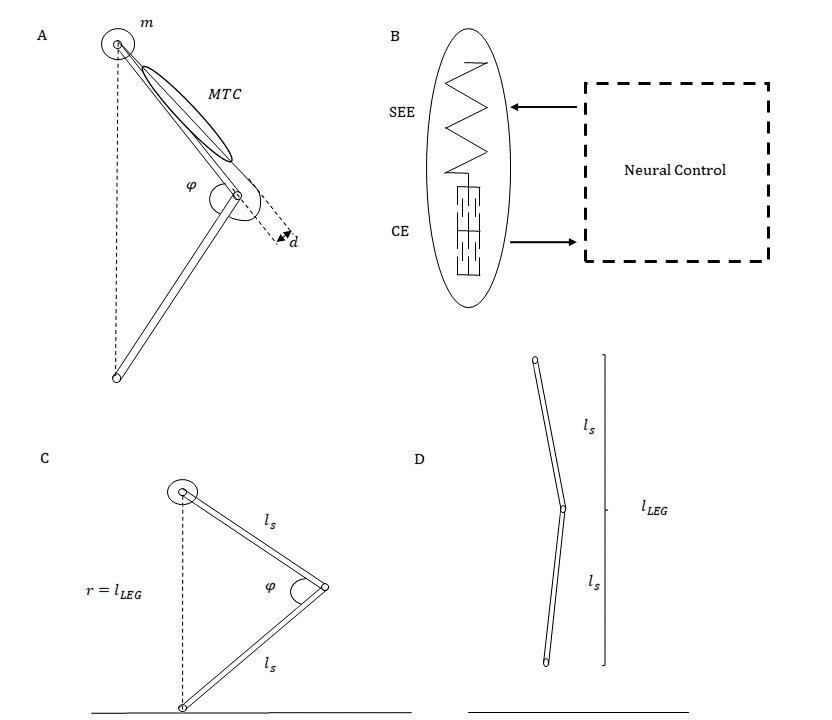
The leg is modeled with two massless segments of same length ls. The body is modeled by a point mass m on the top of the upper segment: the center of mass (COM). The two segments are linked with an intersegmental joint and a Hill-type extensor muscle is acting on this joint.
In order to validate the model, the leg stiffness will be computed and compared with the human data collected by Riese.
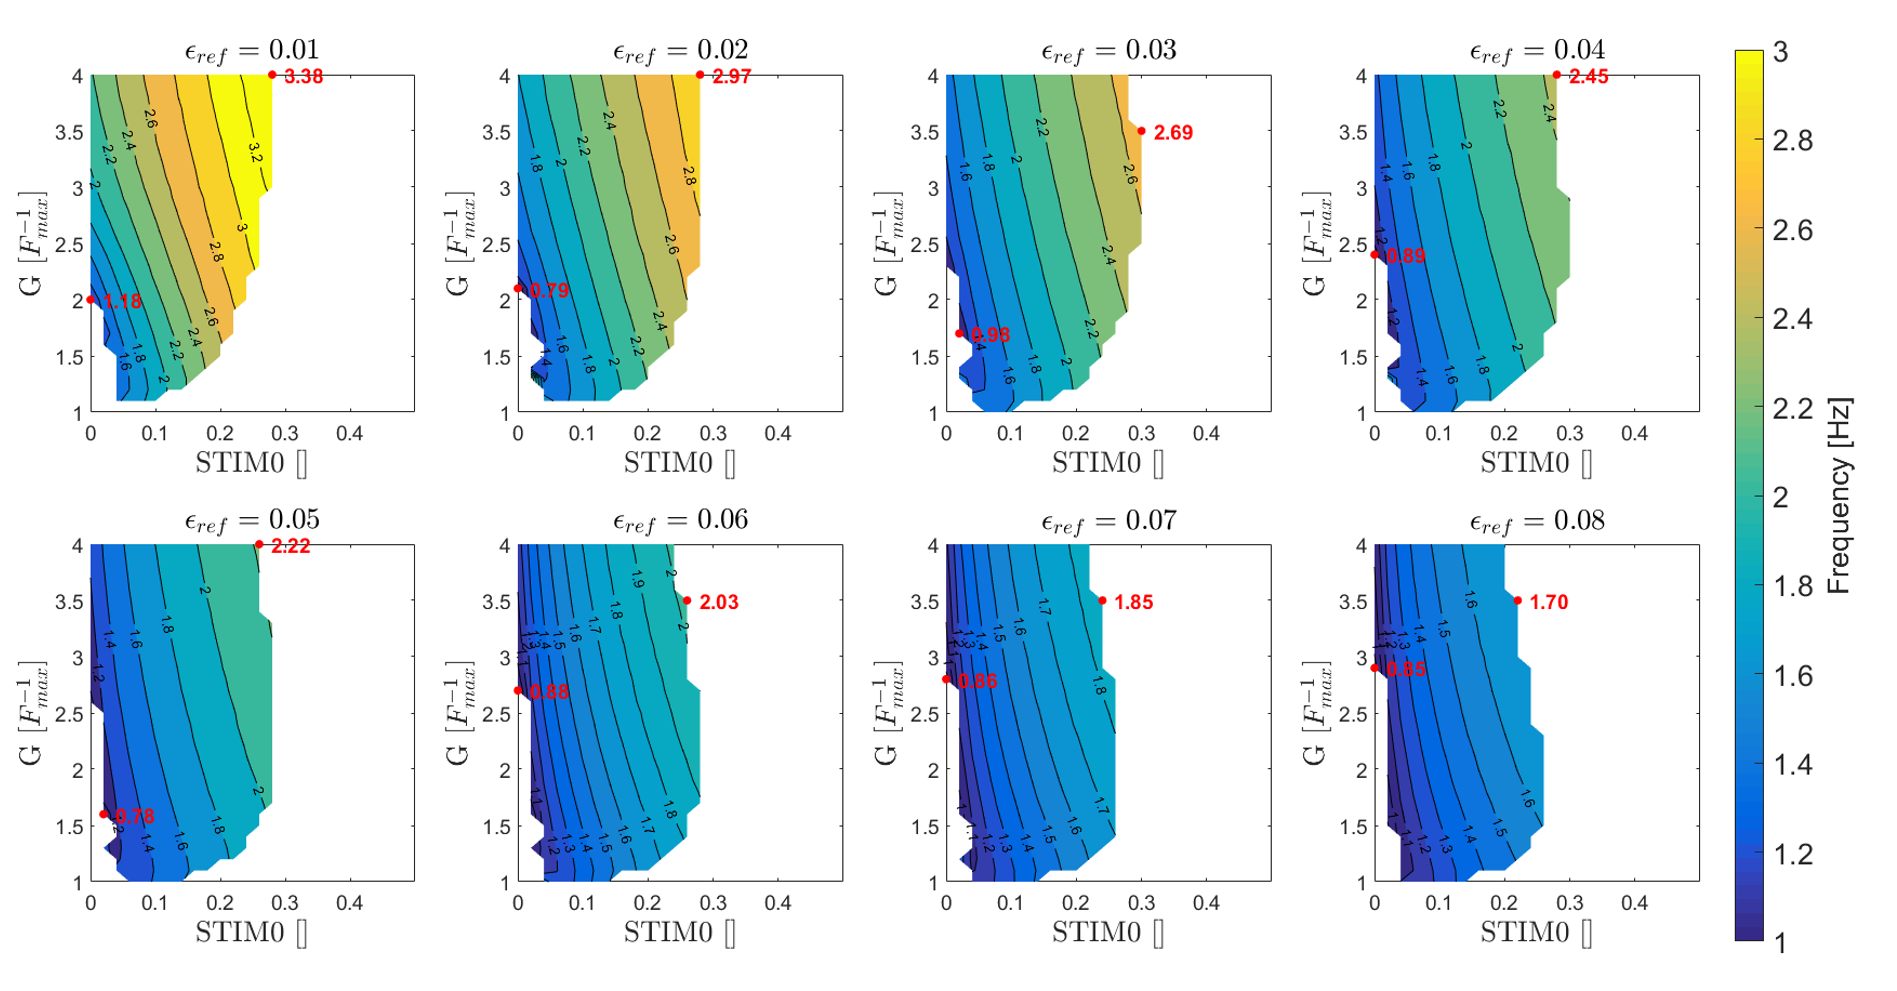
Three parameters have a big influence on the hopping behavior:
- the tendon reference strain εref, which is an important mechanical parameter. Decrease the reference strain εref will increase the tendon stiffness;
- the neural control, which is represented by the stimulation bias (or prestimulation) STIM0;
- the gain G of the reflex loop.
The Figure below shows the influence of these three parameters on the hopping frequency in the model.
Comparison with human data
In this part, we will concentrate on the muscle control. In the original model from Geyer, the activation signal is composed of a prestimulation and of a feedback signal. The feedback signal could be given by the muscle force, length and velocity. In this part, only a positive force feedback is used, since it is the one that gives the better performance results.
We will mimic the real life experiment from Dario Tokur using the model in order to compare the data from the model to the one from the experiment. Dario Tokur performed experiments on subjects hopping on a platform at preferred hopping frequency. At a certain moment during stance phase, the platform drops. The ground reaction forces and the leg compression are recorded. EMG are also performed, but the data are not available yet.
The Figure below shows, for the perturbed stance phase only, the leg force variation over time, the leg stiffness variation over time and the force-length diagram. the blue line is a simulation/experiment without any perturbation, and the different shades of red are for the perturbed cases (step heights): light red (25mm), red (50mm) and dark red (75mm).

Active vs. passive Mechanisms
The passive elements are first the geometry of the system which is two massless segments and a point of mass of 80kg, and secondly the tendon represented by the serial elastic element (SEE). The active element are the muscle represented by the contractile element (CE) and its control.
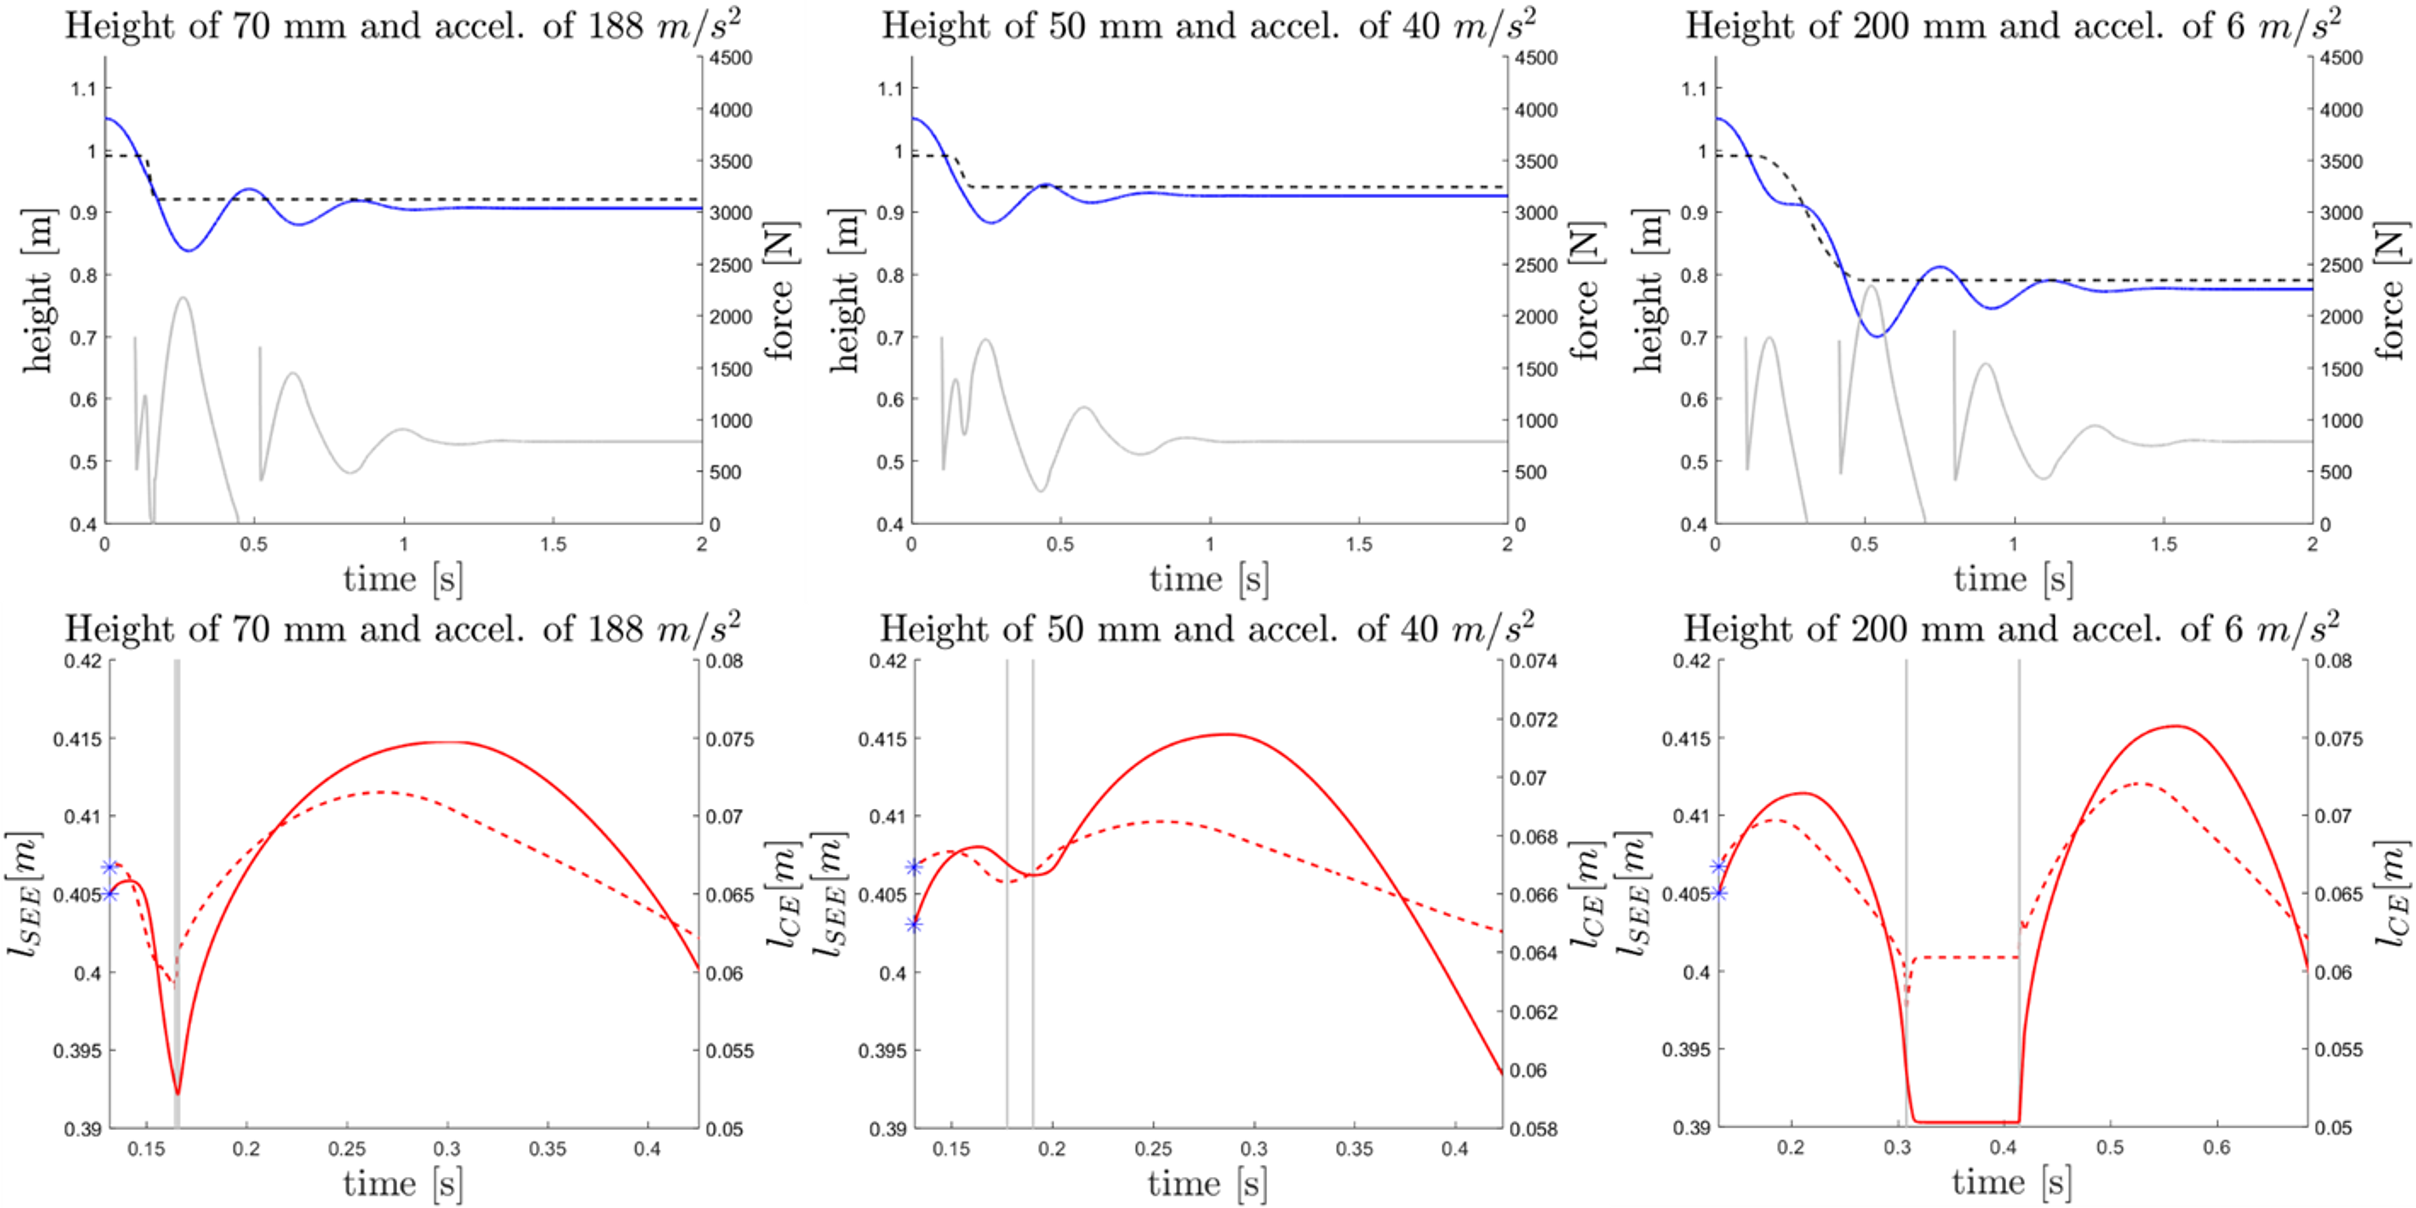
In order to differentiate both contributions, a ground perturbation is added to the system. This perturbation consists of a sudden drop of the ground level during the stance phase. The perturbation will immediately induce a change in the leg mechanics: the leg will extend and the tendon will shorten. And after a delay, the muscle will respond in order to adapt to the perturbation. The expectation is that the response of tendon is fast enough to separate it from the muscle response. This difference in time response is called Δt.
The Figure below shows two types of plot. On the top there are the center of mass (COM) displacement, the boundary between flight phase and stance phase (parallel to the ground level) and the ground reaction force (GRF) in function of time. And on the bottom there are their corresponding CE (muscle) and SEE (tendon) length variations in time with the distance between the two gray lines equal to Δt.
And the Figure below on the right is Δt in function of the type of perturbation (ground acceleration and height).

Muscle activation pattern
In this part we would like identify precisely what the muscle control signal is made of. So, we will modify the muscle control in the model. We will add positive length feedback and positive velocity feedback. A non constant feedforward signal is also implemented. Each one of these control input can be combined and are weighted with a factor between 0% and 100%. The goal is first, to identify the effect of each control method on the system and to distinguish them and secondly, to tune this control in order to obtain an output as close as possible to the experimental data.
The Figure below represents the ground reaction force (GRF), leg stiffness and work loop for the combination of force feedback and length feedback on the top and velocity feedback and force feedback on the bottom.

Conclusion
The model has been proven to be robust against ground perturbation and to allow for multiple modifications and improvements. It was also validated against human data, which is critical as it not only demonstrate its ability to create a stable hopping behavior, but also uses similar features to those seen in the actual human behavior.
Secondly, the passive and active mechanisms in the system were identified and a systematic method to distinguish them was implemented. Using this method, a precise map linking the perturbation type to the correct mechanical outcome, was computed. This enables one to precisely know their effect on the muscle and tendon reaction time in function of the ground height and acceleration.
Finally, one of the most important outcomes of the project was the emphasis on the effects the three different feedbacks, and their combinations, have on the system. For now, it is merely a beginning in our understanding of the reflex pathways.
Literatur
H. Geyer, A. Seyfarth, and R. Blickhan. Positive force feedback in bouncing gaits? . vol. 270, no. 1529, pp. 2173-2183.
S. Riese, A. Seyfarth, and S. Grimmer. Linear center-of-mass dynamics emerge from non-linear leg-spring properties in human hopping vol. 46, no. 13, pp. 2207-2212.